
PaperBanana: Automating Academic Illustration
PaperBanana transforms paper text into publication-ready methodology diagrams and statistical charts through multi-agent collaboration — a text-to-figure AI tool built for researchers.
Built on a closed-loop five-agent architecture, PaperBanana delivers scientific figures that are faithful, precise, and aesthetically polished — so you can focus on the science.
Trusted by researchers from world-leading institutions
Try PaperBanana Now
Experience PaperBanana's automated figure generation firsthand. Simply enter a text description of your desired academic figure, select a visual style from the dropdown, and let PaperBanana create a publication-ready scientific illustration in seconds. PaperBanana supports methodology diagrams, statistical charts, system architectures, flow charts, and poster assets — all generated from natural language input via AI-powered visualization.
No Images Generated
PaperBanana Gallery
Explore what PaperBanana can create — from architecture diagrams to statistical charts and beyond. Every example below was generated by PaperBanana's multi-agent pipeline directly from text descriptions, with no manual editing required.
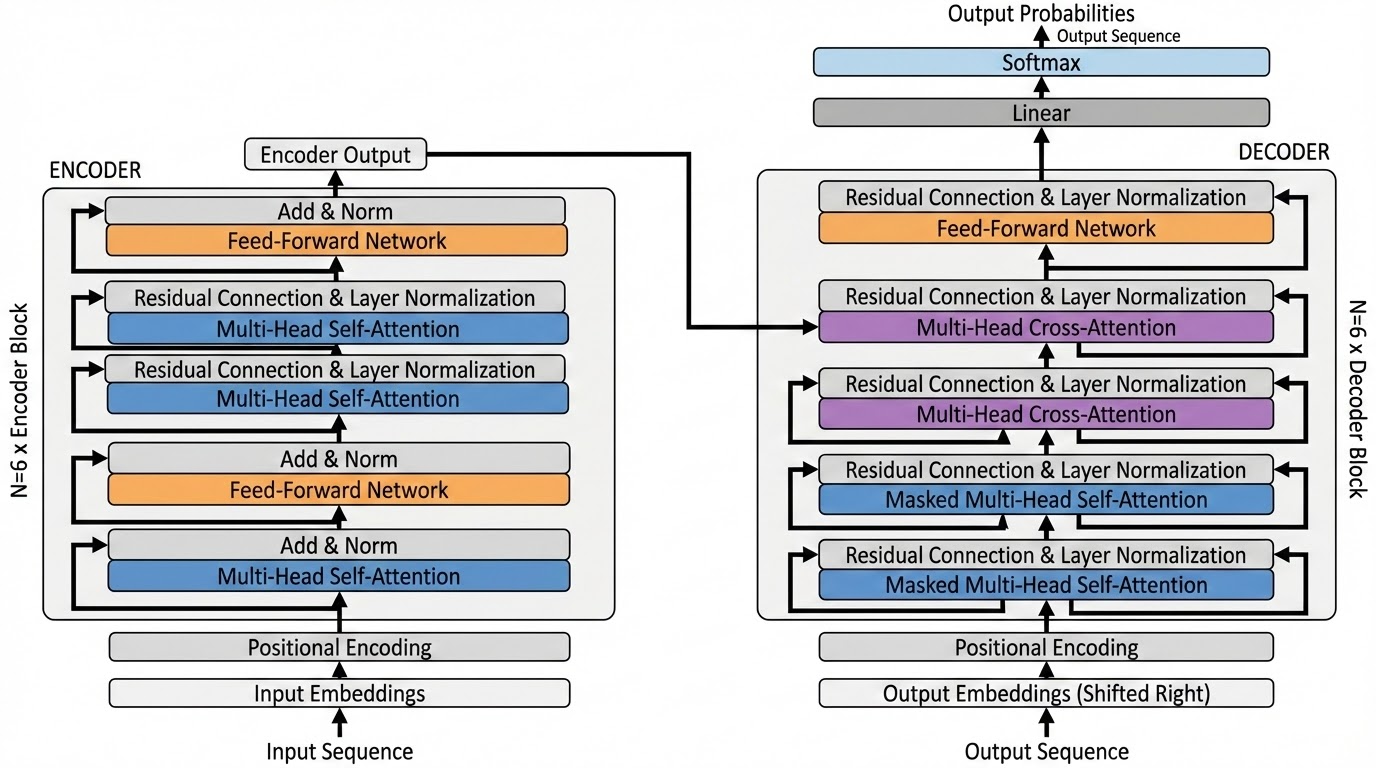
Methodology Diagrams
Methodology diagrams are the core strength of PaperBanana. PaperBanana generates model architectures, algorithm flows, encoder-decoder frameworks, and system pipeline illustrations that meet top-venue standards. The Planner agent translates complex textual descriptions into structured visual layouts, while the Visualizer agent renders them using Nano-Banana-Pro for precise shapes, connectors, and scientific icons. The result is a polished, logically accurate diagram ready for direct inclusion in your paper.
Statistical Plots
PaperBanana produces more accurate statistical charts than general-purpose image generators. Instead of rendering charts as pixels, PaperBanana generates executable Python Matplotlib code from raw data, ensuring that bars, data points, axes, and scales are mathematically precise. This code-based approach completely eliminates the numerical hallucination problem, making PaperBanana the most reliable choice for data-driven academic figures where numerical integrity is non-negotiable.
Aesthetic Enhancement
PaperBanana can transform rough hand-drawn sketches or simple whiteboard notes into professional-grade illustrations suitable for top-tier publications. By applying PaperBanana's auto-summarized aesthetic guidelines, the framework systematically elevates color schemes, typography, spacing, and overall visual quality to meet the rigorous standards expected at top conferences such as NeurIPS, ICML, and ICLR.
Educational Infographics
PaperBanana leverages its built-in Nano-Banana-Pro model to generate highly readable and scientifically accurate educational illustrations. From biological diagrams and chemical reaction pathways to physics concept maps, PaperBanana produces infographics that communicate complex concepts with exceptional clarity, visual appeal, and scientific rigor. These infographics are ideal for supplementary materials, tutorials, and lecture slides.
Aesthetic Refinement
PaperBanana uses auto-summarized Aesthetic Guidelines to polish existing human-drawn diagrams into publication-quality figures. Researchers can submit rough sketches and PaperBanana will systematically refine layout, color palette, typography, and iconography while preserving the original structure and scientific intent of the source material.
Frequently Asked Questions
Common questions about PaperBanana and how it works.
Start Creating with PaperBanana
Join the growing community of researchers using PaperBanana to automate academic illustration. Explore PaperBanana on GitHub, read the research paper, or try PaperBanana's AI-powered illustration generator above to experience the quality of AI-generated academic illustrations for yourself.
Share PaperBanana